An example of the advantage of using a custom printer profile
The images below show graphically what differences a custom printer profile may give you. Please read the methodology of the tests at the bottom of the page, and the links from it, to help understand what these images show.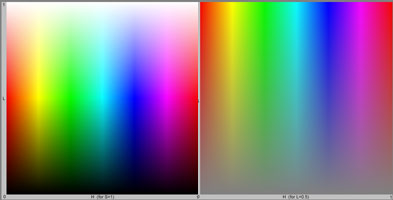 |
These profile tests were for an Epson 2100 inkjet printer using Epson's own Ultrachrome inkset using their matte black ink option. The paper chosen was Epson's Archival Matte. |
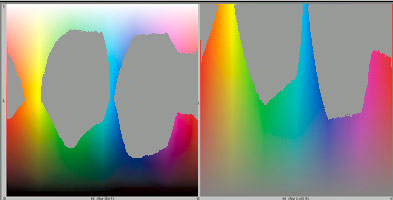
| This file contains the entire RGB spectrum. | |
 |
 |
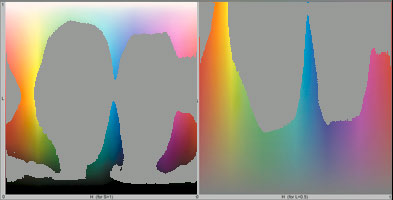
| Epson's own supplied profile. Nice and smooth gradations, overall a good generic profile. | The grey areas indicate the out of gamut colours for the profile. It remains a good gamut range for a generic printer profile. |
 |
 |
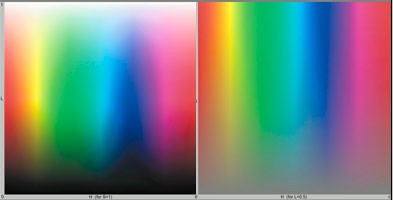
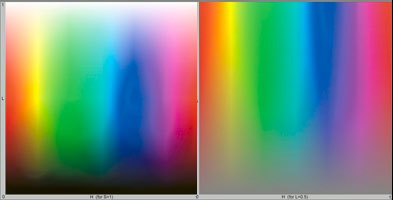
| One of our custom profiles for the same printer/ink/paper made using an annalysis of two different targets. Note the deeper range of reds available and a greater saturation of colours. | This shows a significantly wider gamut for the printer. |
 |
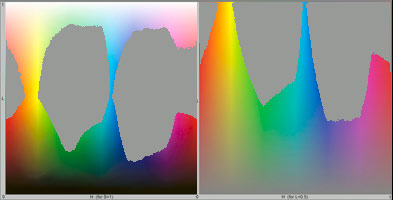 |
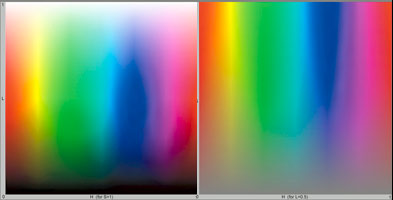
| One of our custom profiles made with just a single test target for the same printer/ink/paper. Note a similar range colours to the profile made with two extended targets, but a small degree of slight banding within the saturated blue area. | This shows a similarly wide gamut as the previous profile, but is just slightly reduced in total gamut. A good profile, but we like to supply you the best possible. |
 |
 |
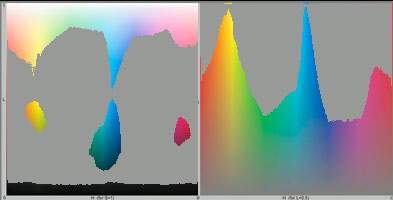
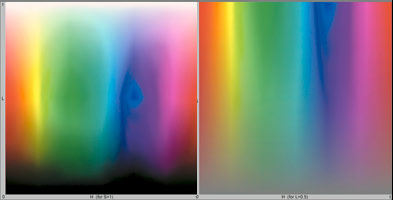
| This profile was generated by a shareware profiling application that uses a desktop scanner instead of a Spectrophotometer. Note the banding and holes in the spectrum. There is also a lack of saturation available overall and a marked banding at the bottom of the spectrum. Not a good profile. |
Whilst this shows that the profile actually has a wider range than the default generic profile, the holes and banding in the spectrum will give odd effects, banding and possibly posterisation in the out of gamut image areas when printed. |
Methodology for the above tests.The testing method used is based on the work of Norman Koren and further details of the file used can be found on his web site. | |